Posts
Showing posts with the label stocks
Stock markets are surging on the back of China's 'nth time' stimulus package, as large as the 2020 pandemic money dump. Pointing towards stimulus programs in the West about to rev up, starting with central banks cutting rates. All this with core inflation still stuck.
- Get link
- X
- Other Apps
NASDAQ falls 5.76% over two days, although this is not at a crash, be wary. Speculation in the tech sector is rampant, and has been holding up global indices with expectations of a crypto/AI dominance. Further unwinding could be on the cards, noting that the headwinds for the global economy are numerous in consecutive beatdowns.
- Get link
- X
- Other Apps
nASDAQ collapses over 2%, on weaker ISM PMI readings from Chinese and U.S. economic gauges. Crude sells off, but holds below $77 on any retaliatory strike by Iran on Israel.
- Get link
- X
- Other Apps
NASDAQ pludges over 2% on a messy profit take (again) after Trump's comment that he will tax Taiwan for military assistance, also note Biden's trade restrictions on Chinese chips to the U.S. . Stocks are looking like a reflation/inflation trade, while the DOW is holding gains as growth stocks are selling off.
- Get link
- X
- Other Apps
the nasdaq is flirting with risk aversion and is grossly mispricing widespread global calamity. Sticky inflation could easily turn into stagflation. Any attack on ISrael by Iran could drive the oil price up over $100 and push short term yields over 7%. Eyes on Crypto/Bitcoin on any major sell offs and speculation crashing in tandem.
- Get link
- X
- Other Apps
Bitcoin is so overbought, it is almost beyond words. Almost...
- Get link
- X
- Other Apps
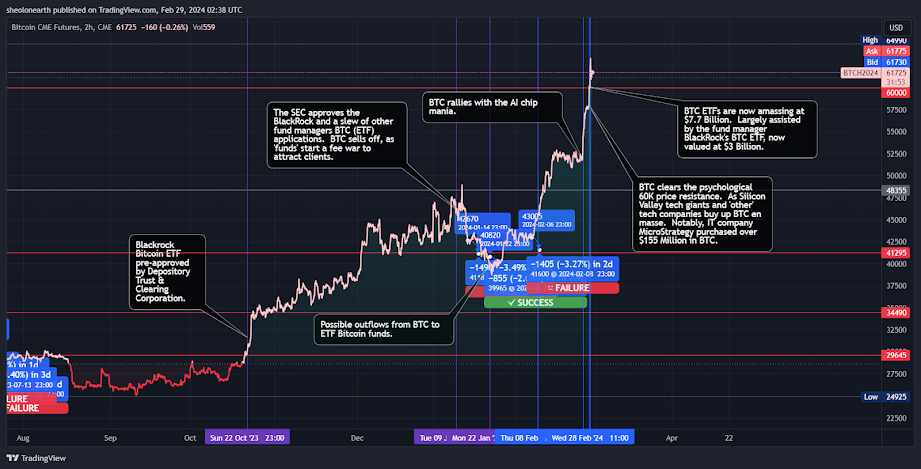
Self explanatory chart/s: Bitcoin (BTC) passes through its 60K price resistance on the back of Black Rock (Fund manager) 'BITCOIN ETF' flooding the Crypto ETF markets at $3.3 Billion. TEch firms and Silicon Valley Heavy weights jump on board. BTC is at a two year high, closing in on 64K.
- Get link
- X
- Other Apps
Self explanatory chart/s: Are we amidst a tech sector bubble lead by AI mania? 1st chart via Kamadar, showing Tech companies are trying to close in on the $2 Trillion market cap. 2nd Chart the NASDAQ 100 via my analysis, showing the rise of the Tech sector after the SVB bailout in March 2023
- Get link
- X
- Other Apps
Self Explantory chart: Indexes rise, with the S&P now clearing its 5000 resistance, trading above 5K. Retail spending collapses to 0.8% in January 2024 following the sharp decline in December 2023 at 0.5%. Are the majority of working Americas tightening pursestrings or cannot compete with rising prices? Market is transfixed on rate cuts in MAy 2024. Reiterate, not with the oil price bid over 75. Can we avoid stagflation in 2024?
- Get link
- X
- Other Apps
CPI blows out at 3.1% with expectations for a 2.9% print. Stock markets drop 1%. USD dollar and oil are bid.
- Get link
- X
- Other Apps
Oil closes in on $77pB, resistance at $78. Market is pricing in a below 3% inflation report hence the Fed will start cutting rates in May 2024. Cheap credit and hope overflows, as stocks are now in bubble territory. Cyclical is leading Growth in a inflation stuck economy. The market is trying to ignore and price out a broader conflict in the Middle East. Double sided U.S. diplomacy only bought some time. Be aware, the "Ides of March" loom.
- Get link
- X
- Other Apps
S&P 500 closes at all times highs. Surges after slump, when Fed chairman Jerome Powell rules out rate cuts, rises on the back rising unemployment in the U.S. I can't see a recession or deflation until the oil price is under $50, stagflation is still on the cards.
- Get link
- X
- Other Apps
Self explanatory chart of the S&P 500 futures, from the last quarter. Market has priced out war and a sticky oil price and gone with CPI deflationary prints, Federal Reserve cutting/pausing rates and the surging tech sector high on an "AI" chip war revving up. Also to note, is the $8 Trillion, of Fed 'pandemic stimulus' that was to the banks, parked in cash and money market funds. *link in post*
- Get link
- X
- Other Apps
self explanatory chart: Orderly sell off or crash? Refer, NASDAQ bull run since December 2023.
- Get link
- X
- Other Apps
U.S. Dollar begins to rise on sticky inflation, a wider middle east conflict, Donald Trump possibly being re-elected as America's president in November 2024. All stock market negative. Stocks bull run for the tailend of 2023 may have come to an end.
- Get link
- X
- Other Apps
The oil price remains bid over $75, OPEC cuts and broader Middle Eastern war may push the price to $80. MArkets are overstretching expectations that rates will be cut in 2024 on a China/U.S. slowdown. Not with unemployment rates at all time lows and higher energy prices. Coffee futures are bid, Brazil is suffering from the worst drought in history. Climate Change should be priced into markets.
- Get link
- X
- Other Apps