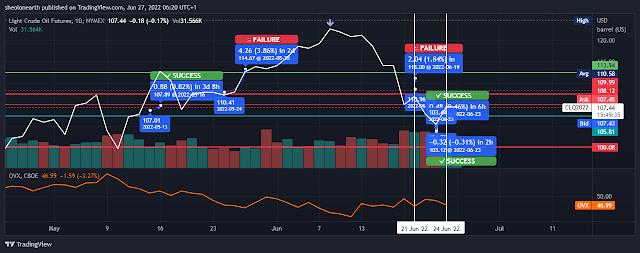
Oil price swing trade is on and off. Caught the sell and rally, on 'confusion' of a slowdown or stagflation recession. Central Bank rhetoric has smoothed out volatility. But for how long? China is about to snap back consumption en masse after COvid lockdowns. Russia will maintain the Ukraine war. Check your grocery bills
I caught the oil price swing trade (Chart 1) from dropping $103.12 from $104 on the 2022-06-23 and then rallying to $103.44 (2022-06-23). Crude futures have since rallied to $107, holding above the $106 resistance and Putin 'put' at $100, there are two contributing factors due to the slight uptick (refer: 21st and 24th: white vertical lines) in volatility (OVX: orange line chart below) with the oil price. 1. Is of course Russia's continued invasion of Ukraine and the EU unable to reach a suitable deal in banning Russian oil/gas. 2. Is China lockdown/s and openings re: COVID-19
China has since reopened its major city Shanghai .
Markets are beginning to misprice, as it did earlier in 2022, stagflation fears of being caught between a global economy slowing and prices/costs of living going upwards. Central Banks, as one would expect, have been slow if not inactive in reassuring the markets of the all clear, rather they have played down a recession whilst claiming inflation can be managed with rhetoric.
Chart 2, could explain why rhetoric can effect bonds prices and create the impression that inflation could be dipping. Note the oil price (vertical green bars) overlaid with the 10-yr Breakeven Inflation rate (orange line), correctly pricing in both inflation and interest rates expectations on April 21st at 3%, with the DXY (U.S. Dollar beginning its rally on the same day (hollow candles). Oil began rallying to its March highs of $120 while the U.S. Dollar was slightly sold off and the 10-yr Breakeven Inflation rate began its decline from 3% to 2.50%. However, the DXY and oil have diverged from the inflation rate, with the 10-yr Breakeven now rallying. Which, judging from its correlation with Oil price and U.S. Dollar is pointing, once again, back to inflation/stagflation trade.
10 YR yield chart has got it right (green line. below pane)
If this is all confusing, there is another way to check.
Grocery and gas/oil prices for your car + pay getting gobbled up.


Comments
Post a Comment